How to Install Google Analytics at a Real Estate Brokerage Website

I know, I know, I promised that the next 5 postings would be about the 5 key factors that determine that your website appears on a search engine query, but I really, really, really have to discuss about the implementation of Google Analytics at www.srbienesraices.com.

The main reason is that this will serve as guide for real estate brokers to implement their own Google Analytics code in their websites.

IMPORTANT DISCLAIMERS:

  1. SYLVIA ROJAS BIENES RAÍCES is a 100% Ecuadorean-owned company specialized in the the negotiation of real estate in the provinces of Guayas, Manabí, Los Ríos, El Oro and with representatives in Azuay.  The home page is www.srbienesraices.com and is in Spanish.
  2. Since August 2007 I have served as the webmaster of this website.
  3. Sylvia Rojas is my mother.
  4. Since August 2007 I have not received any form of payment for maintaining this website and I have incurred in all hosting payments.
/
Let’s get to work!
/
  1. Check that your website works properly!  For example, check for broken links.  There is really no sense to track a website that is full of errors.  In our case, Sylvia Rojas Bienes Raices (from now on referred as SRBR) consists of only 6 pages so it was real simple to check that the website works like it should.
  2. Once you have make sure that your web site works (if not, then DO IT NOW!), open a Google Analytics account at www.google.com/analytics.  If you have an existing Gmail account, you can use that one. If not, then you can create one.  In either case, keep things simple, use an existing Gmail account (no need to have 2 Gmail accounts), or when creating a new one, use a name that you can relate your website to.  In our case, I already have an existing Gmail account.
  3. Add your Website Profile.  You will need your web domain.  In our case is www.srbienesraices.com/, please note that I have added the “/” at the end.  I am not sure of the importance of this parameter, but I have always included it.  (Note to self:  look up why we need it!)
  4. Make sure that you indicate what is the default page of your website (e.g. index.html).  This is important because otherwise Google Analytics would account www.srbienesraices.com and www.srbienesraices.com/index.html as 2 hits!  Unfortunately, that would be cheating!
  5. Google Analytics will provide a Java script code that will look like this:
    http://googlesystem.blogspot.com/2008/03/traffic-stats-for-your-google-documents.html
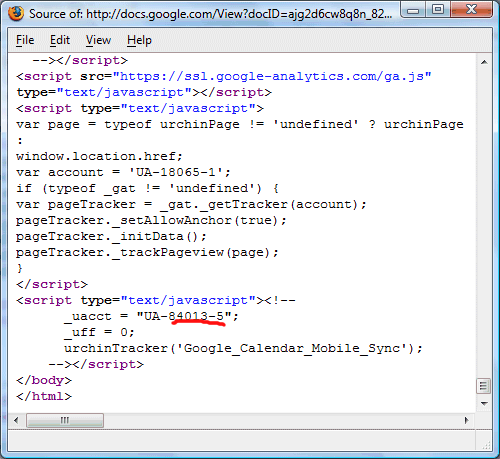
    Sample Google Analytics code. Source: http://googlesystem.blogspot.com/2008/03/traffic-stats-for-your-google-documents.html

    Please note that the red underlined text will be different.  This will be your own Google Analytics account number.

  6. Copy this code.
  7. Open index.html page (home page) using the html editor of your choice.  In my case, I use Macromedia Dreamweaver 8.  Switch to the code or source view.  You cannot paste the Google Analytics code on design view.  You must do it on code or source view.  Make sure that you don’t see the code when you’re viewing your page in preview view.
  8. Paste the code right before the </body> tag.  In our case, it is the second to last line of code.
  9. Save your page.  Make sure that you save the changes!
  10. Repeat steps 6, 7 and 8 with all the pages in your existing website.
  11. Sign up to your FTP server of your hosting service and upload all your updated pages that now include the Google Analytics code.  Note:  yes, you have to replace the existing pages for the Google Analytics to start working.
  12. Confirm that you have entered the tracking code correctly. No idea how to do it? Then try the SiteScan tool from EpikOne, available at www.sitescanga.com, you will just need your home page and an e-mail address to use this free tool.  You will receive an e-mail confirming the status of your tracking code, also you will be able to download a report in CSV format (that means you can open it with Microsoft Excel).  In our case, the report took 3 minutes and all URLS (6 in total).
  13. Wait 24 hours for the code to kick in!  According to Google:
Google Analytics generally updates your reports every 24 hours.  This means that it could take 24 hours for data to appear in your account after you have first installed the tracking code.
Conclusions:
  • The whole process took about 1 hour.
  • After 2 hours of installation, I have not received any data.  This is ok because I am still within the 24 hours. I will check whether Google Analytics has received any data tomorrow.
  • Google Analytics is a Java script based code so make sure that your browser and hosting accepts Java script.
Now, do it yourself!

How to Calculate Keyword Density

I am back from a very nice trip to the beautiful island of Kauai here in Hawaii and I highly recommend visiting this beautiful island for some great sights that will blow you away.  The Kauai island offers great hiking, kayaking, eating, sunbathing options.  If you are interested in visiting an island that keeps that country feeling, then you should definitely visit Kauai.

Here are two samples:

Poipu Sunset - Kauai Island
Jen Toba
Wailua Waterfall - Kaui Island


Beautiful!  Just like today’s topic in the series of the 5 key factors that determine that your website is a returned match on a search engine query.  The first posting was about Google AdWords, the second one about Keyword Prominence and Link Popularity.

Calculating your Keyword Density, that is the percentage that your selected keyword is out of the total number of words in a selected number of web pages, takes 4 easy steps.

Step 1: Write the text of your web page on any text editor of your choice (e.g. MS Word). Or just copy/paste the selected text(s) from your website(s) into the word editor.

Step 2: Find out the total word count of your text using the Word Count tool of your text editor.

Step 3: Using your Find tool, find out how many times your keyword appears on the text.  Write down that number.

Step 4: Divide the number that your keyword appeared by the total word count.  Multiply the result by 100. This is the keyword density of your keyword.

Let’s do an example!

Let’s use the opening paragraph of this post and find the keyword density of island.

Step 1: I copy/paste this text into MS Word.

I am back from a very nice trip to the beautiful island of Kauai here in Hawaii and I highly recommend visiting this beautiful island for some great sights that will blow you away.  The Kauai island offers great hiking, kayaking, eating, sunbathing options.  If you are interested in visiting an island that keeps that country feeling, then you should definitely visit Kauai.

Step 2: From the menu bar, select Tools, then Word Count.  Total word count is 63.

Step 3 : From the menu bar, select Edit, then Find.  The keyword “island” appears a total of 4 times.

Step 4: 4 / 63 * 100 = 6.34%

Easy, isn’t it?

Yes, but there are some important points to consider.

  1. Major search engines have their own “skip words”.  These skip words may or not may not set by the user.  Usually words with three or less letters are skipped (e.g. and, or, I, etc.) and not included in the total word count.
  2. Partial matches may or not be included (e.g. island versus islands).
  3. Tags may or many not be included.
Therefore, when using online Keyword Density calculators, make sure that you look for these three points.  I recommend Google Rankings Keyword Density Calculator (not affiliated with Google).
/
According to Brian Clifton in his How Search Engine Optimisation Works whitepaper, SEO companies usually aim for a Keyword Density between 5 – 10 %.  Our previously calculated Keyword Density in the example above meets that criteria.  Not too bad.
/
See you next time!
Jen Toba
Hiking at Kauai Island


Keyword Prominence and Link Popularity

Keeping the promise that the next 5 posts will be regarding the 5 key factors that determine website appearances on search engine results, I will discuss today keyword prominence and link popularity. The last post was more of a formality that needed to be put in place right away!  Please take it as the idaconcpts blog readers’ bill of rights.


When preparing a website for SEO, keyword prominence and link popularity require more work on the developer’s site because the outcome of these tasks will physically alter the layout of that website.

Keyword prominence takes a look at various factors, but the two most important are 1) the physical location of the keyword(s) and 2) the keyword(s) within page link text.  Physical location simply means that keywords placed at the top of the page are more relevant than at the bottom of the page.  Typically, you will find pay-per-click pages that are trying to maximize their click-rate by using hundreds of keywords at the bottom of the page (either in fine print or mixed with the color of the background).  You don’t want to be one of them!  In the other hand, keywords within page link text is an art by itself.   Check out this free keyword density and prominence tool and use your favorite website.  Keyword prominence checks that the keywords that you select for your website should be within page link text. If your site is about web analytics tools.  Don’t just say, click here.  Better say, for example, click here for better web analytics tools.

Link popularity was invented by Sergy Bin and Larry Page (yup, those Google guys) and it is the foundation of their Search Engine Google.  In simple words, link popularity deals with the quantity and quality of the links leading towards your website.  It is not just a matter of every possible website linking back to your website, but rather the ones that are relevant to your keywords.

Conclusions:

  1. Mark your keywords clearly at the top of every page of your website.
  2. Network! Talk with experts in your field and create partnerships with them so that you can cross-reference each other.


Disclaimers and Disclosures


Note:  This section follows the format set by Avinash Kaushik on his blog Occam’s Razor.

Disclaimers:

This is a personal weblog. The opinions expressed here represent my own and not those of my company or colleagues. Bears repeating: This weblog does NOT represent the thoughts, intentions, plans, actual data or strategies of my company or colleagues.

In addition, my thoughts and opinions change from time to time…I consider this a necessary consequence of having an open mind. This weblog is intended to provide a semi-permanent point in time snapshot and manifestation of the various memes running around my brain.

Feel free to challenge me, disagree with me, or tell me I’m completely nuts in the comments section of each blog entry, but I reserve the right to delete any comment if they are abusive, profane, rude, or off topic – so keep it on topic and polite, please. I love a healthy debate so fire away.

Disclosures:

I am a Marketing and Public Relations intern, currently at Blue Lava Technologies. In my role I work with Google analytics tools such as Google Analytics, Google Trends and other Google reporting interfaces (such as AdWords).  In the future, I will add more analytics tools from different companies.

I am not in the board of directors of any company and I do not hold stock of any companies that I discuss about in this blog.  In the future, I plan to join the Web Analytics Association.

On this blog for tracking I primarily use WordPress Blog Stats.  I am not compensated or incented in any way for using these tools.

A permanent post is available here.

More on Google Ad(key)Words

This post will be short and sweet because I need to take a drive road test today because I am buying a brand new car!

Yesterday on my way home, I was reviewing a SEO whitepaper by Brian Clifton and Nikki Rae from Omega Digital Media tittled “How Search Engine Optimisation Works”.  This 20-page document explains how search engines work and how search engine optimisation (SEO) can help you achieve high search engine visibility.

According to Clifton and Rae, web sites appearance on search engine results depends on 5 key factors (p. 8):

  1. Which Keywords the user entered
  2. Your web page Keyword Density for these keywords
  3. Your web page Keyword Prominence (page location) for these keywords
  4. Your Link Popularity – the number of other sites that link to you
  5. Your link and keyword Relevancy
These 5 factors are essential for SEO and I promise that the next 5 posts are going to be on these topics. In the meantime, let’s take a look at idaconcpts WordPress Blog Stats regarding keywords that that returned matches with www.idaconcpts.com:


As it becomes obvious the term that returned the most matches to idaconcpts is google analytics flickr.  This makes sense because as of right now, 08/21/2008, my post that has an analysis of Flickr using Google Analytics is the most viewed page of this blog (30 views).  The term flickr was included in 7 out of 20 of the search engine queries that matched idaconcpts.  The term google had the same outcome.

Therefore, the terms google and flickr are golden ones to consider for my personal Google AdWords campaign.  However, the important part is to be able to combine with appropriate terms (remember quality over quantity! I want my readers to remain in the blog, not leave right after they click on it!).  Possible keywords are google analytics and the different mispellings of analytics (e.g. analytic, analystics, analytis)!  Believe or not, including this misspelled words, inflates my search engine keyword result matching.  Cheating?  Clifton and Rae don’t believe so!

(p. 9) Don’t forgit misspelled keywhords!  (p. 10) The Google Trends tool is an excellent free resource for checking mispellings, relative keyword popularities (e.g. product X versus product Y) and regional variation (e.g. cell phones versus mobile phone).

What do you think?

Find your Top 10 Google AdWords (feat. Vampire Weekend)

There has been a lot of movement at our office over the last and current week, a lot of colleagues coming in to finalize the details of our product launch.  Given the nature of our product launch, I cannot write much about it, but I can tell you that in about 20 days I will be able to give more details.

In the meantime, let’s talk about one of my assignments:  to find the top 10 Google AdWords for us.  The main goal is to set up a monitoring systems that allows us to monitor these keywords in conversations relevant to us on Blogs, Twitter, Friendfeed, etc.  Sounds easy?  I wish!

Finding the right (key)words is hard, just like NY prepsters, Vampire Weekend sing on “Oxford Comma”:

Haven’t got the words for you / All your diction dripping with disdain / Through the pain

So what is a web analytics newbie to do?  I set on the following 3 tasks:

  1. Review Brian Clifton’s “Advanced Web Metrics with Google Analytics” for all mentions of Google AdWords.
  2. Review Google AdWords’ Keyword Tool.
  3. Read relevant blogs on the subject.


Given the urgency of our product launch, I have only been able to do the two first tasks so far (and have not been able to blog about it, until today!).
Let’s see what I got:
First, the book by Clifton is really great and I can see referring to it a lot in the future.  It already has lots of page separator’s by subject.  If this book is either sitting on your shelf or on your Amazon.com wish list, here is a motivator to pick it up.  Check the following pages on tips regarding AdWords:  73-75, 92, 103-105, 173, 190-201, 299-305 and 308.  The tips range from setting objectives of your AdWords campaign to creating filters on Google Analytics reports to determining key measures such as cost per acquisition.
One of the main problems with selecting and monitoring keywords is the specific/broad dilemma, that is whether to choose a campaign based on “shoes” versus “blue shoes”.    A broad match set on “shoes” would allow you to measure web visitors that searched for “blue shoes”, “nice shoes”, etc., while a specific match set just on “shoes” would only measure web visitors that searched “shoes” only.  Also, a specific match set on “blue shoes” would not include a keyword search like “pair of blue shoes”.
Second, after reviewing the Google Adwords’ Keyword Tool, the mentioned problem becomes evident.  By generating keywords using descriptive words or phrases I get some interesting results. For example, I am particularly interested in “photo sharing”, which has an approximate average search volume (AASV) of 165,000.  Not too bad…I thought.  Just the keyword “photo” has an AASV of 20,400,000!  The keyword sharing has an AASV of 2,240,000!   What is a web analyzer to do?
Think outside of the box!, said Vampire Weekend.
So if there’s any other way / To spell the word / It’s fine with me, with me
-.p
The next step is to generate keywords using your actual website content, let it talk to you.  After inputing our company address I got very good leads like “photo gallery” with a healthy AASV of 823,000 and “slideshow” with 1,000,000.  Funny, these are key features that I had not consider before and they make more sense (besides having a greater AASV!).
Conclusions:
  1. Check your handbook / It’s no trick:  There is a lot of literature available on selection of keywords.  Try the tutorials at Google AdWords and AdSense first, then complement your ideas with Clifton and web analytics’ blogs (refer to my Blogroll on the left side for some references).
  2. Adjust my tie / Know your butler, unlike other guys: Two words > Keyword Tool!  Listen to your website.  Let it do the legwork for you.
  3. I met the highest lama / His accent sounded fine:  Quality over quantity.  Selecting a single word with a high AASV may provide you a greater hit rate, but these site visitors may just exit on your home page after realizing that your site has nothing to do with their search.  Remember the key is conversion!
me!
Vampire Weekend playing "Oxford Comma" at Pipeline Cafe (Honolulu, HI). Photo credit: me!

Apple vs Mac using Microsoft adCenter Labs

Today I began reading Avinash Kaushik’s Web Analytics: An Hour a Day.  Supposedly I was going to read it for an hour (as the title clearly states!) but I found myself immersed in it for about 2 hours.  The book is packed with useful terms, acronyms, companies, examples, best practices.  All of this in just the first 49 pages.  Just to name a few:  customer driven innovation (CDI), Coremetrics, Omniture, WebTrends, WebSideStory, Clicktracks, comScore, packet sniffers, etc.  A lot of food for thought for future posts here at idaconcpts.com.

Originally I wanted to discuss about Kaushik’s trinity, whose objective is actionable insights and metrics, but I got caught with Microsoft adCenter Labs.

I had no idea about the existence of this lab, so it is quite sensible to explain what it is all about (in their own words):

Microsoft adCenter Labs is an applied research group dedicated to researching and incubating new digital advertising technologies. Formed in 2006, Microsoft adCenter Labs combines the talents of more than 120 top researchers and engineers, all dedicated to developing cutting-edge ways for consumers and advertisers to connect. Our researchers work across a broad range of technology areas, including keyword and content technologies, audience intelligence, ad selection and relevance, social networking, and video and interactive media. The algorithms developed by our team operate in the engines of Microsoft adCenter products such as Paid Search, Content Ads, and Behavioral Targeting. We are also committed to investing in developing online advertising products that will shape the future of advertising through more relevant and meaningful ads across online video, television and mobile devices.

Here you can find plenty of free little tools that (if correct) would provide great insight into the field of web analytics.  Just as Kaushik recommends, this website is “perfectly suited for 1) learning lots and lots and lots about search engine keyword behavior and long-term trends 2) understanding the demographic profiles for your (or your competitor’s) website visitors.”

Learning lots indeed!  Today I had to continue to network to learn more about the needs of organizing large collections of photographs.  I cannot go into much details but I can tell you that gender distribution is a major factor in my analysis. One particular question that I have is what are the differences between male and female Mac (or Apple!) users, and how does their experience relate to their use of Flickr.   Let’s use the Keyword Forecast tool from Microsoft adCenter Labs to find some insights into this question.

According to Microsoft, “This tool forecasts the impression count and predicts demographic distributions of keywords. Enter keywords separated by semi-colons and click the submit button.”

So, I used the terms:  Apple: Flickr; Mac.  Originally I was going to just use Apple or Mac but after finding the results I found that there important differences about the keywords Apple and Mac.

Keyword Search using Apple, Mac and Flickr

From the graph above, it becomes clear that before March 2007, the keyword Apple had a much higher trend than the keyword Mac, something happened in March 2007 that turned the tables around for the relationship between these two keywords.  I would have to look into that and a useful tool for that would be Google Trends.

But let’s continue to use this tool for now.

Gender Distribution of Mac, Apple and Flickr

Wow! According to this graph, it appears that for the period 04/2006 – 06/2007, the keyword Apple is associated mostly with females and the keyword Mac is associated mostly with males.  This is a key finding for marketers trying to reach a particular gender of Mac (or Apple!) users.  It appears that talking about Mac to a female audience of Powerbook users is not such a good idea!  Earlier we discussed that Flickr.com is very related to Divinecaroline.com, so this would be an important to consider if Flickr is trying to reach female Apple users at the latter website.  The keyword Flickr has almost neutral association with either women or men so the tipping point would be the use of Apple or Mac.

Lastly, the Keyword Search tool offers an age distribution bar graph.

Keyword Age Distribution for Apple, Mac, and Flickr

From the graph above, my main observations would be that 50+ old keyword users prefer the keyword Apple over Mac, and that 25-34 old keyword user prefer Mac over Apple.  All other age distributions seem quite normal.

Conclusion:  vive le diference! Gender is highly important for SEO for Mac related web analytics projects!

What do you think?

WordPress Blog Stats, iPhone and Literature Review

From my last post, I got the attention from the WordPress staff! : )

Not to worry, I still love WordPress!  I just wish that the WordPress Blog Stats where as detailed as the Google Analytics.  One of my main complains is that the graphs are flash (opposed to JPEG, GIF, etc) and I cannot copy them here that easily.

Let’s take a look at the WordPress Blog Stats below from idaconcpts.com for the period between 08-06-08 and 08-13-08:


idaconcpts.com WordPress Blog Stats as of 08-13-08


I apologize for the messiness.  Here are the main giveaways:


  • Flickr and Google are key search terms that drive readers to this blog.  Writing about those two companies should spark more interest about this blog.
  • If a reader arrives to my page, there is a high probability that he/she will check the “About the author” section.  It is the most popular page.  Caveat:  it is quite possible that most of these views happened on 08-06-08 when idaconcpts.com went live and in that day there was only one post and the “About the author” page.
  • I really need to work on making my articles more interesting, because I only had 9 views on the last 2 days (yes, the 13th is not done yet but this is the data so far!).
In more commercial news, today I got an 8GB iPhone 3G and I am really excited!  Hopefully this weekend I will be able to play around with it and download a couple of applications.  A colleague is developing a Hawaiian-themed game that he will put online.  It looks pretty darn good!  Will keep you posted both on my iPhone shenanigans and my colleague’s iPhone game launch.
Last night I received the following books from Amazon.com:
The Four Steps to the EpiphanyBook Cover
I am really excited and looking forward to review these books.  Blank’s work guides how I approach online users and has converted me 100% to the Customer Development Process.  Then, I want to review Clifton’s work to get a better understand of web metrics with Google Analytics.  Finally, I will literally follow Avinash’s book an hour a day to improve my understanding of web analytics.
Have a great day and now…get back to make some more money! : )
Dinner at Nagoya, Japan on 03/08/08

Installing Google Analytics @ WordPress

This is the second week of idaconcpts.com and I am really happy to have received comments from:

  1. Justo Ibarra from www.doctormetrics.com, to who I would like thank for his help installing the Google Analytics tool at my blog.  Doctor metrics is an Analytics Authorized Consultant and Urching Client Service & Support Partner from Google.  Check out his blog for helpful updates on the state-of-the-art of web metrics.  His blog is only available in Spanish.  The doctor is in!
  2. Avinash Kaushik, author of Web Analytics:  An Hour a Day (which I highly recommended on an earlier post).  His latest post, inspired my last post about doing web analytics of Flickr.com using Google Trends.  His summary of what is Web Analytics 2.0 all about is amazing!  It surely makes my life easier to explain what is my job!  Check out a visual summary below from Avinash’s website:

Today I have spent a decent amount of time installing the Google Analytics tool @ idaconcpts.com and I am sad to tell you that despite the help from both gentlemen mentioned above, the review of several blogs regarding this topic at WordPress and Google; I am very sad to announce that I could only install it on the “About the Author” page.

Let’s review this problem!
WordPress does not allow code in Java:  Even though Google Analytics does provide a copy/paste code for WordPress (just like Shelfari), this code is not accepted because it involves Java code, which is cancelled at WordPress.  There are two ways to get around this issue:
  1. Host your website on a private domain and then use the WordPress application to upload your blog.  (Caveat:  This solution is good for Windows users but it is a bit problematic for Mac users.  Being a recent Mac convert, I will have to keep you posted on how to tackle this issue.)
  2. You can install it the code by deleting from the code all the 4 script type lines.  However, the text will appear and then you will have to hide it using white font. I am aware that my solution is not very elegant but it appears to work.
It is very funny that I tried to discuss this topic at the WordPress Facebook page but it was considered to be inappropriate!  This is surprising because I am no the only one looking for a solution!
Since I hosted idaconcpts.com at WordPress, I don’t have access through FTP to my content, so I cannot incorporate the Google Analytics code into it.
Conclusion:  What are possible solutions?
  • Adding a widget feature to WordPress.
  • Offer the service as an upgrade.
  • Ask WordPress users to be better programmers (ha!).
What do you think?


Web analytics of Flickr.com using Google Trends

On the latest post from web analytics guru, Avinash Kaushik, he discusses into a lot of detail the use of Google Trends as a free and acceptable competitive intelligence tool.

So what is so hot about it?

According to Google:  “With Google Trends, you can compare the world’s interest in your favorite topics. Enter up to five topics and see how often they’ve been searched on Google over time. Google Trends also shows how frequently your topics have appeared in Google News stories, and in which geographic regions people have searched for them most“.

Interesting!  Not only that but “When Google Trends detects a spike in the volume of news stories for a particular search term, it labels the graph and displays the headline of an automatically selected Google News story written near the time of that spike.”  In simpler words, we can find the a plausible explanation for that spike in the search term.

As part of my work, I have to follow closely the activities of Flickr.com.  After reading Avinash’s entry I rushed into doing some web analytis of Flickr.com using Google Trends.

Let’s see what I found out.

Daily unique visitors at Flickr.com
  • The graph above indicates the number of daily unique visits at www.flickr.com.  Flickr’s daily unique visits has gone up and down over time but has an upward trend wordwide.
  • Worldwide visitors who visited this site also visited:
  1. flickr.net (no surprise there)
  2. bighugelabs.com (tools/widgets/applications to use in Flickr)
  3. divinecaroline.com (e-zine for women, so I can have the hypothesis that photo sharing websites should focus on women!)
  4. cracked.com (a place to kill time)
  5. photobasement.com (photo-blog)
  6. failblog.org (photo-blog)
  7. consumerist.com (name says it all, independent consumer report site, don’t really understand the connection here)
  8. digital-photography-school.com (blog that teachers better photography techniques)
  • Flickr is searched mainly in the USA.  Second to the USA, India is ahead of all other countries in looking/visiting Flickr.
  • Inside of USA, California is by far the most active subregion with Flickr.
  • According to this data, consumerist.com and divinecaroline.com are the top other sites visited by Flickr visitors.  #3 is cracked.com.
Search Volume Index of term, photo sharing, using Google Trends
  • The second graph above shows the search volume index for photo sharing.  The letters indicate important news related to that point in time.  It is interesting that these stories are related to a company/organization promoting a better photo-sharing product/service (e.g. Flickr, Avanquest, lenzus.com, Ubicom.

Conclusions:

  1. Photo sharing is only exciting if it is better.
  2. Tools&widgets communities support the further development of a photo sharing community.
  3. Women spend time looking at pictures online. Let’s focus on them!  The wedding photography idea is really good.
  4. There is a connection between consumerist.com and flickr.com.  No idea what it is, but it might worth the while to check it out.
  5. People that spend time looking at pictures online also spend time looking at photo-blogs for quick laughs.

The term conclusions seems a bit overwhelming, I would prefer to name them hypothesis that I would like to further investigate.  However, the main point of this exercise is to demonstrate that Google Trends is a free competitive intelligence tool that provides good ideas to check your web analytics processes.

What do you think? : )