Celebrity Style News

Robert Pattinson.

Kristen Stewart.

Robert Pattinson and Kristen Stewart Dating!

You may or may not have an opinion about this.

However, if you’re in the online marketing business you should definitely start paying more attention to the celebrity entertainment industry.

Celebrity Style news  are a strong  source of Internet traffic.

Let’s review the impact of using keywords related to the celebrity entertainment industry.

Robert Pattinson and Kristen Stewart Dating

Continue reading “Celebrity Style News”

How to target your audience using Facebook Ads


For the last week, I have been pretty busy creating and tweaking online ads at Google Adwords and Facebook Ads, so I thought it would be useful to provide a bit of advice from my personal experience using Facebook Ads.

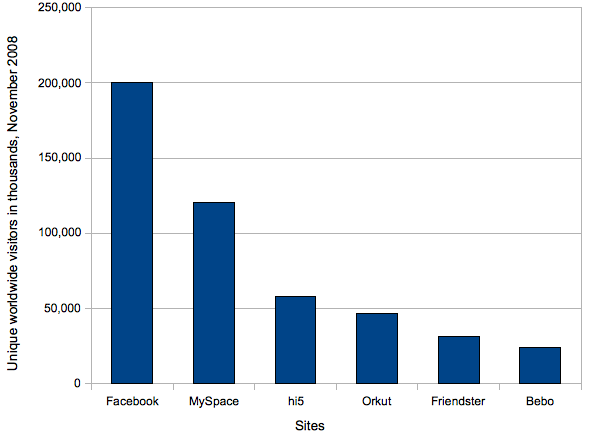
Why did I choose Facebook Ads?  Consider the following bar graph from Venture Beat’s article titled Facebook’s traffic growth leaving rivals in the dust.

socnets010709

For simplicity, I will assume that you want to drive visitors to a single website.


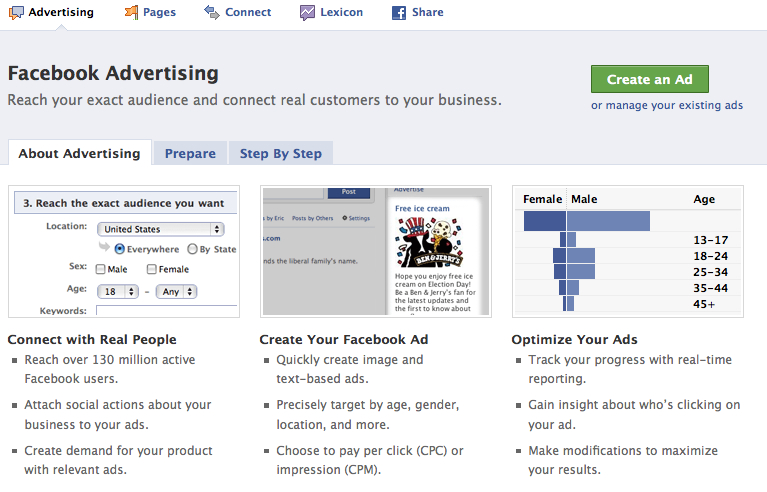
facebook-advertising

  1. Do your research: You cannot expect Facebook Ads to do miracles for you.  It will do a pretty decent job at providing impressions but the “clickability” of your ad is 100% up to you.  Forget one-size-fits-all approaches, you will require to develop at least 5 ads (I am currently working with 8).  You need to think about the profiles of your website visitors.  For a quick video tutorial of this idea, take the quick tour of the web attitudinal web analytics firm iPerceptions from Canada.  (Avinash Kaushik is on their Advisory Council, so yes, you have to listen).  Is your ad audience: female? male? young? old? English speaking? Time-constrained? Etc, etc, etc.  Preparation of audience profiles should be about 60% of your time dedicated to develop online ads.target-your-audience
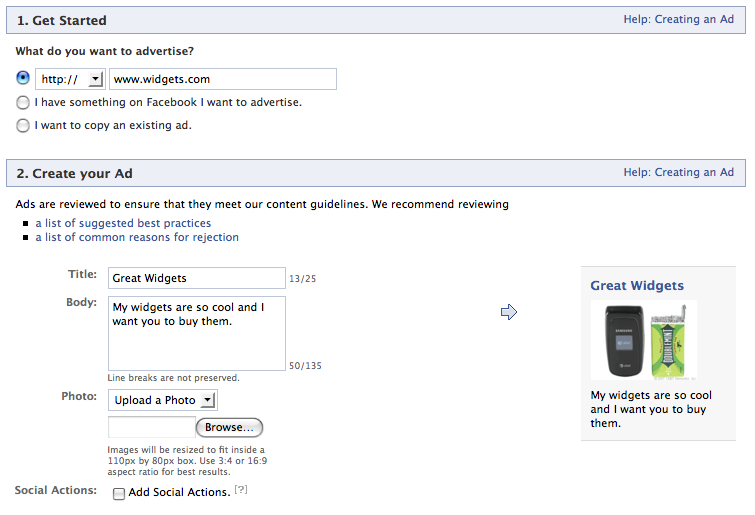
  2. Select your text and image for your ad: As you can see from the two ads below, you can have a subject line of 25 characters, text of 135 characters, and you can upload an image (there are appear no limits on the image file size because Facebook will resize it to fit the add).  example-of-adsIt is important that you have a variety of images available because you will be needing as you A/B test your ads.  Notice that Facebook users can give your ad a thumbs-up or a thumbs-down to your ad!  Don’t try to fully capitalize words (e.g. FREE), or use strange characters (keep to the regular alphabet, both using different languages is ok, actually I encourage it!).  Remember to use proper punctuation, otherwise your ad won’t be approved.  great-widgets
  3. Think of the keyword(s) of your ad: This step is critical because it will allow you to use SEO and SEM tools such as Google Trends.  Let’s assume that you want to promote your great widgets at www.widgets.com.  So an important keyword to consider would be “widgets”.  Let’s check out what is the search volume index of “widgets” at Google Trends.  widgetsWow, this is a lot of useful information!  Notice that we get a couple of relevant news that show what drove queries for this term.  Company names and product names are useful because then you can go into their websites and see what are their current SEO and SEM practices.  Also, you should look if the already have ads around Facebook.  Don’t try to reinvent the wheel and keep an eye on the current practices of your competitors.  It is also important to check out what keywords are related to your keyword, what regions (or countries or cities) provide the most queries for your keyword, and what languages are those queries made on.  Another important source of information is Google Ad Planner.  For a discussion on how to use Google Ad Planner, refer to this web analytics analysis of Flickr, Photobucket, Shutterlfly, Snapfish, and Slide using Google Ad Planner.
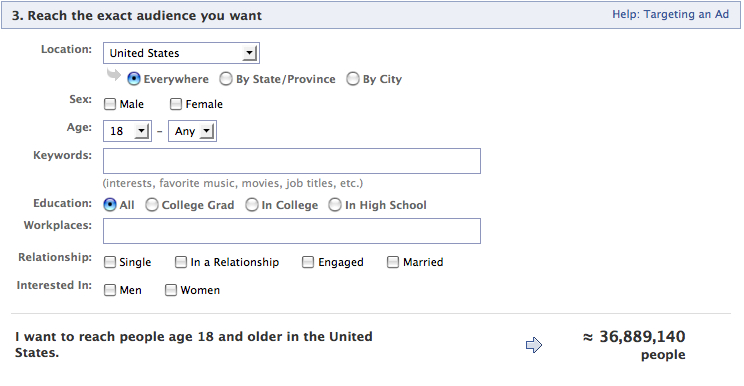
  4. Reach the (exact) audience you want: facebook-audienceUsing the information from the previous steps, you can fill in the fields on step 3.  Notice that not all keywords are available at Facebook, so its important that you look for keywords related to your own keyword(s) of choice.
  5. Price your ad: I will skip this step for now, because it deserves a whole post of its own.  If this is your first time creating Facebook ads, then I would recommend setting the price towards the  lower limit and setting a total budget for 1 month.  Keep track of your A/B testing and then you will have enough information to develop a more detailed pricing strategy.

That’s it for now and happy experimenting with Facebook Ads!

How many pageviews do news-oriented web sites need?

Today I ran into an interesting article from my daily feed of Online Media Daily.  If you are curious how it would look in your mailbox, it would be something like this:

Screenshot of Online Media Daily

Nicholas Carlson wrote an eye-catching article titled “NYTimes.com Needs 7X More Traffic To Survive (NYT)”, which summarizes the findings of an advertising study of contentNetxt.  Basically contentNext states that news-oriented web sites operations can be sustainable at the 200 million pageviews mark.

Carlson explains further:

“Based on our research, the conversation [with advertisers] gets interesting at 200 million page views plus a month, but much more so around 800 million,” ContentNext’s Lauren Rich Fine writes in a report.

For big operations, like at Yahoo (YHOO), AOL (TWS) or the New York Times (NYT), that bar needs to be even higher. In order to survive as a Web-only news product, for example, Fine says the New York Times needs about 1.3 billion pageviews a month.

That’s about 1.1 billion more pageviews than the 173 million ComScore says NYTimes.com saw in October.

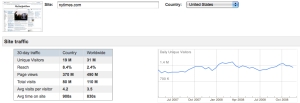
Here’s a bit of a problem that I have with these numbers.  If you go to Google Ad Planner and take a look at the numbers for the New York Times, this is what you get:  490 million pageviews in a 30-day period.

Google Ad Planner shows web metrics of the New York Times.com.
Google Ad Planner shows web metrics of the NYTimes.com.

I might sound a bit picky but I wish there was more consistency in reporting a web metric such as pageviews.  As a web analytics consultant, if I was to try to understand how to increase traffic at NYTimes.com, I would start by taking a look at the trends in daily unique visitors  as to segment (or slice like a ninja, as Avinash Kaushik would say) the audience into customer experiences.  Given that I am cheap, I try to work with free data as much as possible, so free tools such as Google Trends and Google Ad Planner are my best friends.

Going back to the cited article, contentNext mentions that for news-oriented online operations, the bar needs to be set really high at more than 1 billion pageviews. Yahoo! and AOL are cited as examples.

Let’s take a macro view of the audience demographics of Yahoo!, AOL and NYtimes.com.

audience-of-yahoo-aol-and-nytimes

My conclusion is that NYTimes.com should target more its female readers (notice how Yahoo! and AOL have a bigger percentage of female visitors) and its younger readers (notice how Yahoo! and AOL have a high number of visitors on the under 18 category, that is the first bar on the age graph).

This is just a general suggestion, but it’s a start.  Besides, it’s free advice, unless of course they would like to hire a new web analytics expert. : )

What do you think?

Revisiting Flickr versus Snapfish versus Photobucket versus Slide versus Shutterfly


Yahoo! Flickr - 468x60

The response to the post:

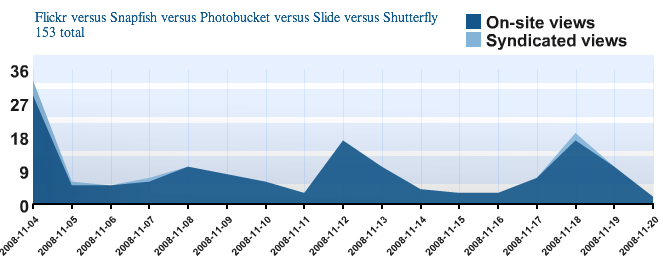
Flickr versus Snapfish versus Photobucket versus Slide versus Shutterfly

has been great! Thank you very much for reading it. Here is a breakdown of the number of daily readers provided by WordPress BlogStats

big-5-stats

I am really happy that my Spanish colleague, Gemma (who writes a great web analytics blog in Spanish called ¿Dónde está Avinash cuando se le necesita?, a great tribute to Avinash Kaushik) found some inspiration to use Google Trends (one of my personal favorite tools!).

Another great tool for broad research is Google Ad Planner (currently in Beta, so you need an invitation, mine took about a week to arrive).

Let’s take a look at the BIG 5 (Flickr, Photobucket, Snapfish, Shutterfly, and Slide) of online digital photo sharing using this tool:

using Google Ad Planner
Flickr versus Snapfish versus Photobucket versus Slide versus Shutterfly: using Google Ad Planner

Google Ad Planner provides much more in-depth information on a monthly basis (the figures for unique visitors and pageviews are on a 30-day basis).  The reach is for the United States.  As discussed on the previous post, Photobucket appears to continue to have the upper-hand over Flickr.

What I found really interesting is that if I was to theoretically put ads on these 5 sites trying to reach everybody in the United States, I would reach 31 million or have a country reach of 13% or have 660 million pageviews.

Do you think that is a lot? Wrong! Take a look what would happen if I just select Facebook and Myspace:

big-2-together

That’s 90 million unique visitors or a country reach of 39% or 20 billion pageviews!

Does that mean that advertising on Facebook and Myspace is better than advertising on the top 5 of online digital photo sharing?

If your objective is to monetize on printing services, I would dare to say no.

Why?

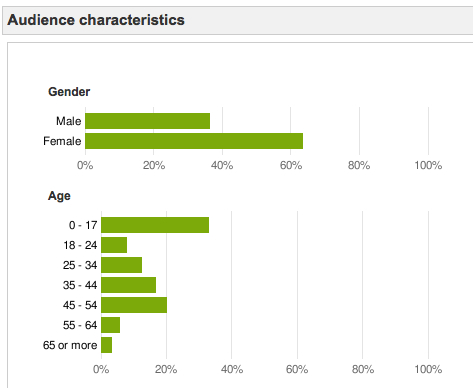
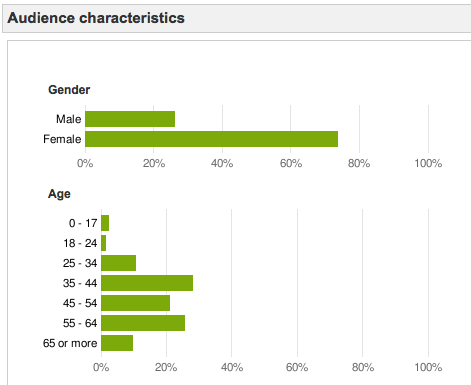
Take a look at the age and income distribution of the audience at Myspace using Google Ad Planner:

myspace-audience-1myspace-audience-2

Compare it with the demographics of the audience at Shutterfly:

shutterfly-audience-characteristics-1shutterly-audience-characteristics-2

Obviously Shutterfly has a more mature audience with more spendable income, so they would be more prone to spend on printing services than a younger audience with a tigther budget.

Of course, you could argue against this hypothesis.

Yahoo! Flickr - 300x250

Let me hear your thoughts.


Flickr versus Snapfish versus Photobucket versus Slide versus Shutterfly


An important part of my job is to understand the trends in the online photo sharing industry and I wanted to provide a couple of insights to my readers using Google Trends.

Daily Unique Visitors of 5 key players in the online photo sharing industry.

For the period May 2007 – September 2008, Flickr and Photobucket compete for the highest number of daily unique visitors worldwide out of the five selected online photo sharing:  Flickr, Snapfish, Shutterfly, Photobucket and Slide.

Take a look at the latest performance of Photobucket and Flickr:

What caused that there were more daily unique visitors at Photobucket than at Flickr?

Yahoo! Flickr - 300x250

Photobucket is capturing more daily unique visitors than Flickr in the top photo sharing market: U.S.

However, Photobucket should not rest in its laurels, because Flickr is ahead in the second most important photo sharing market: India.

What about Slide?  Slide enjoyed an important spike in the last quarter of 2007, but its number of daily unique visitors is coming back to previous levels.   What caused this?

2 reasons: hi5 and England.

Worlwide, people who search for the the term “slide”, also search for:

As you can see, hi5 appears several times and it different languages!

This is relevant because hi5‘s daily unique visitors worldwide dwarfs that of the top 5 players in the photo sharing business (note: I drop Snapfish, because Google Trends only accepts 5 websites at a time).

Plus, Slide did pretty good during that period in England!

Finally, what about Snapfish and Shutterfly?

They depend on each other because:

People who search for “snapfish” also search for “shutterfly”.

And people who search for “shutterfly also search for “snapfish”.

In conclusion:

  1. Markets outside of the United States DO matter!  Increased demand in important markets (e.g. Slide in England, Flickr in India) can generate a lot of views, which potentially means increased ad revenue.  Just ask Dave McClure, web analytics guru and blogger at Master of 500 Hats.
  2. Despite all the hype about international markets, the leader must keep its focus on the top market, the U.S.
  3. Keep a close eye on the SEO tactics of your rivals and copy what seems to work (Shutterfly and Snapfish).


Yahoo! Flickr - 468x60

What do you think?


Language and Regional Analysis Google’s Picasa using Google Trends

First of all, it is important to point that it is not possible to see the Daily Unique Visitors graph of http://picasa.google.com using Google Trends. Also a big mahalo (thank you in Hawaiian!) to fellow Photo Lover, Katharine Osborne, for showing me Skitch. This great little image capturing & editing tool for Mac has made my blogging much easier.

Why Picasa?  Well, in my personal opinion, the 2 main players for desktop applications in photo organizing & sharing for Mac OS are:

Teaser: what are the differences between the 2 of them? : ) Coming soon!

Since it was not possible to look for the Daily Unique Visitors graph, I looked for the Search Volume Index of the term “picasa”.  Here’s what you get:

The letters correspond to relevant news, here’s the list:

The biggest spike, highlighted with the letter A, happened after the release of Picasa 2.0 by Google, back in 2005 which included a series of improvements such as picture captioning and blog-posting ability (for the whole list check here).  A spike in the search volume of the term “picasa” is expected around the date of a new release.  This is supported by event F, because on September 3, 2008, Picasa 3.0 was released.

What was really interesting is that the United States does not appear among the top 10 regions where the term “picasa” is searched for!!
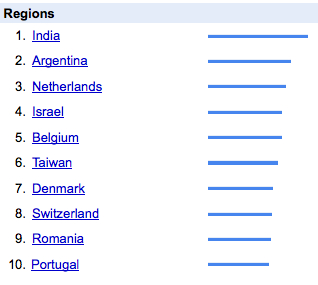
Is this possible? Is it an error? Let’s analyze the following:
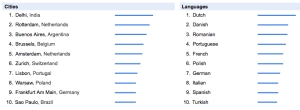
Notice that there appears no U.S. city on the top 10 cities that search for “picasa” and that English does not appear on the top 10 languages!

This finding is very interesting so I adjusted the upper right setting for region from:

to:

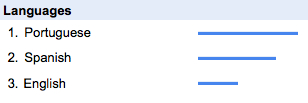
and I found that English is the 3rd language of the region when searching for “picasa”!
Conclusions:

  1. The term “picasa” is searched more around the release date of a new version of Picasa.
  2. Google’s Picasa has a stronger presence abroad than in the United States.
  3. Google MUST consider that the majority of its users come from outside of the U.S., so web sites version in different languages might be needed to support its users.  This situation is not strange, the same thing happened to Flickr.com.

Why are these conclusions relevant?

Consider the following for Apple’s iPhoto, when looking for the term “iphoto”, this is what I found:

Notice that:

  • United States is the second region where most searches happen.
  • 8 of the top 10 cities, where the searches happened, are inside of the U.S.
  • English is the top language of the queries.

This illustrates the difference in strategies between Apple’s iPhoto and Google’s Picasa.

What do you think?

More on Google Ad(key)Words

This post will be short and sweet because I need to take a drive road test today because I am buying a brand new car!

Yesterday on my way home, I was reviewing a SEO whitepaper by Brian Clifton and Nikki Rae from Omega Digital Media tittled “How Search Engine Optimisation Works”.  This 20-page document explains how search engines work and how search engine optimisation (SEO) can help you achieve high search engine visibility.

According to Clifton and Rae, web sites appearance on search engine results depends on 5 key factors (p. 8):

  1. Which Keywords the user entered
  2. Your web page Keyword Density for these keywords
  3. Your web page Keyword Prominence (page location) for these keywords
  4. Your Link Popularity – the number of other sites that link to you
  5. Your link and keyword Relevancy
These 5 factors are essential for SEO and I promise that the next 5 posts are going to be on these topics. In the meantime, let’s take a look at idaconcpts WordPress Blog Stats regarding keywords that that returned matches with www.idaconcpts.com:


As it becomes obvious the term that returned the most matches to idaconcpts is google analytics flickr.  This makes sense because as of right now, 08/21/2008, my post that has an analysis of Flickr using Google Analytics is the most viewed page of this blog (30 views).  The term flickr was included in 7 out of 20 of the search engine queries that matched idaconcpts.  The term google had the same outcome.

Therefore, the terms google and flickr are golden ones to consider for my personal Google AdWords campaign.  However, the important part is to be able to combine with appropriate terms (remember quality over quantity! I want my readers to remain in the blog, not leave right after they click on it!).  Possible keywords are google analytics and the different mispellings of analytics (e.g. analytic, analystics, analytis)!  Believe or not, including this misspelled words, inflates my search engine keyword result matching.  Cheating?  Clifton and Rae don’t believe so!

(p. 9) Don’t forgit misspelled keywhords!  (p. 10) The Google Trends tool is an excellent free resource for checking mispellings, relative keyword popularities (e.g. product X versus product Y) and regional variation (e.g. cell phones versus mobile phone).

What do you think?

Web analytics of Flickr.com using Google Trends

On the latest post from web analytics guru, Avinash Kaushik, he discusses into a lot of detail the use of Google Trends as a free and acceptable competitive intelligence tool.

So what is so hot about it?

According to Google:  “With Google Trends, you can compare the world’s interest in your favorite topics. Enter up to five topics and see how often they’ve been searched on Google over time. Google Trends also shows how frequently your topics have appeared in Google News stories, and in which geographic regions people have searched for them most“.

Interesting!  Not only that but “When Google Trends detects a spike in the volume of news stories for a particular search term, it labels the graph and displays the headline of an automatically selected Google News story written near the time of that spike.”  In simpler words, we can find the a plausible explanation for that spike in the search term.

As part of my work, I have to follow closely the activities of Flickr.com.  After reading Avinash’s entry I rushed into doing some web analytis of Flickr.com using Google Trends.

Let’s see what I found out.

Daily unique visitors at Flickr.com
  • The graph above indicates the number of daily unique visits at www.flickr.com.  Flickr’s daily unique visits has gone up and down over time but has an upward trend wordwide.
  • Worldwide visitors who visited this site also visited:
  1. flickr.net (no surprise there)
  2. bighugelabs.com (tools/widgets/applications to use in Flickr)
  3. divinecaroline.com (e-zine for women, so I can have the hypothesis that photo sharing websites should focus on women!)
  4. cracked.com (a place to kill time)
  5. photobasement.com (photo-blog)
  6. failblog.org (photo-blog)
  7. consumerist.com (name says it all, independent consumer report site, don’t really understand the connection here)
  8. digital-photography-school.com (blog that teachers better photography techniques)
  • Flickr is searched mainly in the USA.  Second to the USA, India is ahead of all other countries in looking/visiting Flickr.
  • Inside of USA, California is by far the most active subregion with Flickr.
  • According to this data, consumerist.com and divinecaroline.com are the top other sites visited by Flickr visitors.  #3 is cracked.com.
Search Volume Index of term, photo sharing, using Google Trends
  • The second graph above shows the search volume index for photo sharing.  The letters indicate important news related to that point in time.  It is interesting that these stories are related to a company/organization promoting a better photo-sharing product/service (e.g. Flickr, Avanquest, lenzus.com, Ubicom.

Conclusions:

  1. Photo sharing is only exciting if it is better.
  2. Tools&widgets communities support the further development of a photo sharing community.
  3. Women spend time looking at pictures online. Let’s focus on them!  The wedding photography idea is really good.
  4. There is a connection between consumerist.com and flickr.com.  No idea what it is, but it might worth the while to check it out.
  5. People that spend time looking at pictures online also spend time looking at photo-blogs for quick laughs.

The term conclusions seems a bit overwhelming, I would prefer to name them hypothesis that I would like to further investigate.  However, the main point of this exercise is to demonstrate that Google Trends is a free competitive intelligence tool that provides good ideas to check your web analytics processes.

What do you think? : )