iPerceptions: Internet Business Model Analysis

Welcome back, today we are analyzing the Internet Business Model from the leader in web attitudinal web analytics, the Canadian firm iPerceptions.

Here at idaconcpts, I have mentioned how their 4Q service can make the Internet a less scary place.

In this post I’m going to analyze iPerceptions Business Model.

Microsoft Word
First, a little bit about the company history of iPerceptions:

iPerceptions (TSX: IPE) is a provider of web-focused Voice of Customer analytics.  Founded in 2000, iPerceptions focuses on a goal of “improving and optimizing websites by tapping into the feedback of real customers in the context of actual online experiences.”   Its mission is to revolutionize web analytics by fully democratizing the voice of the online customer. The vision of the company is to have customers speak for themselves and to ensure that they are heard at the highest decision making levels.  iPerceptions focuses not on “what” customers do on the web, but “why” they do things on the web.   It helps its customers understand who is going to their websites, the reasons for going, and how satisfied they are with completing their goals.  The company provides innovative ways of tracking customer behavior and translating that information into usable strategic support that can companies can use to optimize their Internet channel.

Many knowledgeable and well-known technological leaders that bring experience and innovation to the company form iPerceptions’ management team and advisory board.  These people include Jerry Tarasofsky (President, CEO), Stephen Berns (CIO), Jonathan Levitt (VP, Marketing), and Avinash Kaushik (author of Occam’s Razor).  Its client list spans many different industries including hotels, automobile manufacturers, electronics, IT companies, and includes many large companies such as Dell, Toshiba, Reebok, BMW, and Yamaha.

While the company has yet to be profitable, its client list and management team are impressive attributes to this young company.  The company has sound performance goals and prominent clients that rely on their services.

Next, here is an analysis of its e-commerce industry:

iPerceptions is an on-demand provider of web attitudinal, web analytics services and research for online marketers and Fortune 500 companies.  iPerceptions’ solutions impact two traditional business intelligence practices:

1. Website Analytics and

2. Market and Customer Satisfaction Research.

Because iPerceptions’ solutions overlap with many companies in different areas, it is hard to differentiate iPerceptions’ services from others. Each competitor in the web analytics field seeks to differentiate from others by offering a unique approach. Therefore, given the infancy of this industry, there are no true substitutes, but rather, competitors with different approaches.

Competitors (an abbreviated list):

  1. Behavioral Analytics: This is a traditional way to track online customer behavior by using cookies and other tracking devices.  Major companies in this sector include: Web Trends, Omniture and Coremetrics.
  2. Traditional Research Analytics: This is the way to gather data by surveys e.g. telephone surveys and online surveys. Major companies in this sector include: Ipsos-Reid, Nielsen, Harris, Survey Site, Zoomerang, Insight Express, Survey.com and Keynote.
  3. Web attitudinal web analytics: Analyzes customer behavior analysis by customer survey, such as interview and questionnaire, would be considered as direct competitors of iPerceptions. For example, ForeSee is a company that collects customers’ feedback by online Voice of Customer.
  4. Traditional Customer Satisfaction Vendors: Customer Satisfaction Vendors will initially rate the client company using online surveys, polling, regular and online panels and focus groups to generate syndicated Customer Satisfaction reports.  Customer Satisfaction Vendors then provide solutions and work with clients to improve their ratings. Major companies in this sector include J.D. Power, Merits, and Harris Interactive.
  5. CRM Analytics:  A broad category of analytics to help companies improve the customer relationship by combining data from various customer interactions e.g. website visits and call centers.  Major companies in this sector include: SAS, SPSS, SAP, Microsoft, Oracle, and Seibel.
  6. Clickmaps:  Click maps attempt to study customer behavior by statistical analysis.  The major player in this category is CrazyEgg.

Improve Your Site2019s Conversion Rate and your Online Sales

Is iPerceptions’ business, a profitable one?

iPerceptions’ revenue margin has consistently been about 50% of sales for the last few years.  Its operating expenses however are very high, exceeding its annual revenue.  These high operating expenses are mainly due to sales and marketing, administrative costs, and research and development.  These types of expenses are often elevated in a young, growing company that is actively trying to improve its product and gain market share.

iPerceptions current model is to charge a single fee for full service.  However, in order to continue utilizing a large operating budget it is important to acquire alternative sources of revenue.  Some potential possibilities could be:

  • Provide advertising space on their sites or surveys.
  • Create partnerships with hosting companies or blogging services (e.g. WordPress).
  • Produce a subscription-based consulting magazine based on web analytics.
  • Produce industry reports using data from the iPSI satisfaction index that could be available for purchase.
  • Provide online workshops to inform users about web analytics, the tools present, and how to use and interpret them.

Stock Market Quotes | Stock Market Quotes and Symbols

Conclusions and recommendations:

With the entry of Google Analytics, the web analytics market has simply exploded, because now anyone who wants to have access to data from their website can have it for free.  Yahoo’s and Microsoft’s anticipated free web analytics tools will only expand the options that practitioners have at their disposal.  But access to the tool and data, although empowering, does little to ease the problems related to figuring out what a company’s success metrics are and how to perform web analytics correctly.  This is mainly why web analytics solution providers such as iPerceptions still stay in business.

The main obstacle of iPerceptions is the need for a more sustainable business model.  While the major expenses in R&D and sales and marketing are necessary to keep up the first-mover image of iPerceptions, these expenses are not sustainable in the long run, unless alternative, and more importantly fixed sources of revenue are created.  Therefore, it is recommended that iPerceptions research the following alternative channels of revenue:

1.    Partnerships with hosting companies: Hosting companies such as GoDaddy compete fiercely against their competitors to differentiate themselves as the better provider of hosting solutions.  Differentiation is achieved through the offering of a variety of pre-installed plug-ins that range from blogging tools (e.g. WordPress) to mail management tools (e.g. MailChimp) to e-commerce tools (e.g. Google Checkout).  iPerceptions could make a similar offering with its 4Q online customer satisfaction tool.

2.    Consulting magazine: iPerceptions already holds a wide array of information about web analytics.  The company could use some of this information to create an online (or offline) magazine that offers some content for free to create a base of readers.  If the reader following of iPerceptions becomes large enough, then the company could sell advertisement space to potential advertisers or marketers.  Another alternative is that iPerceptions could charge a monthly or annual fee to readers that would like access to premium content without any advertisement.

3.    Industry reports: iPerceptions could release industry reports and sell them online.  The cost of creating an online store for web analytics reports is quite low, however iPerceptions would have to analyze whether making reports available online for a fee does not give away too much information about its iPerceptions Satisfaction Index (iPSI).

4.    Online workshops: iPerceptions could experiment with live web-seminars to corporate clients as a way to expose clients to the array of services it provides. By providing a live web-seminar to key personnel inside organizations, iPerceptions could tip the balance in the decision of whether or not the potential client should hire the services of iPerceptions.  The low-cost of a live web-seminar could provide an inexpensive way for the key decision maker to make a more informed decision about hiring iPerceptions, while providing extra revenue at the same time.

Adding extra sources of income in the internet business model of iPerceptions has a positive impact on the scope, that is the market segments to which iPerceptions offers customer value and the range of products that contain value.  The customer value component improves because iPerceptions will be able demonstrate that its customer value is distinct from that of its competitors.  Given the infancy of the web analytics field, this is a challenge for all competitors, new and old.  Another important observation is that the revenue source component improves in the new Internet business model because the described alternative sources of income should have higher profit margins because of their scalability.  The price component is indicated as a positive change because the company would improve its value for the customer’s dollar on the consulting side of business by implementing the alternative sources of revenue.  In the final analysis, we believe that there will be important improvements in the relationship between iPerceptions’ revenues and the underlying costs of generating the revenues (cost structure component).  This is the main objective of the proposed Internet business model, to expand the customer audience of iPerceptions, in order to divide the fixed costs (R&D and marketing) over a larger base of customers and revenue.  iPerceptions needs to take advantage of the low marginal cost of adding an extra customer.  Perhaps it wouldn’t hurt that R&D and marketing expenses become more efficient and accountable so that is that there is a better understanding of how they contribute to generating revenue.  iPerceptions has the right management and board of advisors to implement this business model, however it needs to act fast to be able to survive to current recession of 2009 as companies are downsizing in their expenditure of consulting services.

Here’s a slideshow that summarizes the presented Internet Business Model Analyisis of iPercetpions:

Is the Internet a Scary Place?

Apparently, the Japanese seem to think so. Via the eMarketer Daily, I found that according to Marsh Research, 84.4% of adult Internet users in Japan have felt at least once that the Internet is “scary.” Here is the breakdown: 102735 Now, why do they consider the Internet scary? 102734
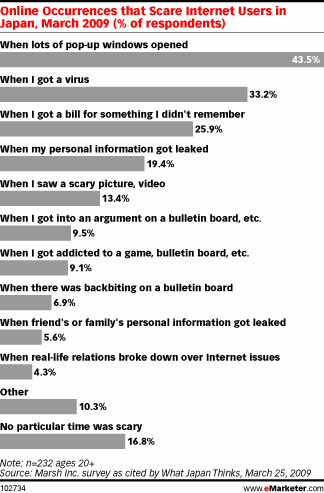
Notice that at the top of the list appears “when lots of pop-up windows opened”.  Have you been a victim of  a “rickroll”?  Definitely annoying. Extreme use of pop-up ads is what Seth Godin refers to as interruption marketing.  You’re interrupting the natural flow of the user experience to say “hey, buy this!”.  Remember that ads or communications can only be effective if they are relevant, personal, and ANTICIPATED.  You need to employ permission marketing (another Godin term). I believe that the only way to a marketer can make a pop-up ad relevant, personal and anticipated is through the use of a tool such as 4Q from iPerceptions. Here’s a 10-minute video explanation of 4Q by Google Analytics Evangelist, Avinash Kaushik.

Here’s an example of how 4Q looks like at the CIO website:

4q-at-ciocom

Using permission based marketing initiatives, we can all make the Internet a less scary place. If you want to learn about how to get started with E-mail Permission Marketing, here’s a primer.  Once you have read about it, you can learn about E-mail Permission Marketing Fundamentals.

E-mail Permission Marketing Fundamentals

Thank you for the response via e-mail and comment post at idaconcpts.com about last week’s post regarding E-mail Permission Marketing.  If you’re still interested on the free copy of the first 4 four chapters of Seth’s Godin Permission Marketing, please e-mail me at damian [at] idaconcpts [dot] com.

So, you’ve created a great product or service and you have users lining up to register online for your product  or service so they can use it.  You have provided the option to received personal, relevant, and anticipated messages; and guess what? they are choosing to do so by clicking on the checkbox!.  Excellent! You cannot believe that people are interested in you and you  send out your first e-mail…and…now what?

This week I’m going to discuss, the basics of the “now what”: the E-mail Permission Marketing Fundamentals.

Let’s take a look at what Avinash Kaushik has to say on this (Web Analytics: An Hour a Day, p. 220):

chinese-question1Before you start your analytics, it is important to understand, at least at a high level, that there several important steps to the process of executing e-mail campaigns:

  1. Define business objectives and how e-mail fits into them.
  2. Identify core criteria for e-mail campaigns (what, why, how, when, and so forth).
  3. Create and execute campaigns (mine your e-mail list, scrub it for do not contacts, create the right text or other type of offering, and send it to your e-mail vendor).
  4. Analyze your campaigns.

Email analytics can focus on both ends of this process:  defining objectives and criteria as well as campaign analysis.
chinese-target

As you can see, planning is 90% of any e-mail permission marketing campaign.  You cannot expect results, if you don’t have an idea of what good results are.   The most important part is that you have to figure a return-on-investment (ROI) for obtaining 1 unit of your desired goal (e.g. one download of a software, one download of a flyer on how-to-stop smoking, one call to one 1-800 number, one view of a blog post, etct).  That’s the ultimate goal that you want to set up first before anything.  How much are you willing to spend in order to get 1 unit of your desired goal?  Once you set that goal, write in 60 font size, print it out, and hang it somwhere visible in your working space.  This will guide your overall e-mail permission marketing campaign.

However, before getting to the specifics of calculating the ROI, we need to establish the fundamental metrics.  Remember, walking before running.  In the case of an effective permission e-mail, you can only have up to 2 goals, for example:  a) click here to learn more about my great website, b) click here to download my great free mp3, c) click here to make an appointment, etc.

The funnel strategy of your permission e-mail is that people:

  1. Actually receive your permission e-mail.
  2. Open your permission e-mail.
  3. Click on the link you want them to click.

In order to track these results, you will need the following metrics.  Kaushik suggests that you use an e-mail vendor, however I will assume that your operation is pretty small and does not exceed a couple thousand e-mails.  At that level, there are only a couple fundamental metrics that you need to worry about.

  1. Number of e-mails sent
  2. Number of opened e-mails
  3. Number of bounced e-mails
  4. Number of unsubscriptions ( You MUST provide this option! Remember that we are doing e-mail permission marketing. No permission = no e-mail.)

chinese-smartsWith these metrics you will determine:

  1. Delivery rate = (number of e-mails sent – number of e-mails bounced) / number of e-mails sent
  2. Unsubscribe rate = number of unsubscriptions / number of e-mails delivered
  3. Open rate = number of opened e-mails / number of emails delivered
  4. Click-through rate (CTR) = number of clicks / number of e-mails opened

That’s it, nothing more, nothing else, to get started.  I believe that even with little or no experience, you should be able to calculate everything except the CTR.

I will disccus the specifics of setting up the measurement of CTR with Google Analytics on the next post.

Thank you for your time.

A brief history of web analytics

As part of a MBA assignment, I had to summarize the history of web analytics.  I thought it would be nice to share it with you:
– – – – – –

The official definition of web analytics by the Web Analytics Association is the measurement, collection, analysis and reporting of Internet data for the purposes of understanding and optimizing Web usage.   This standardized definition was not proposed until 2006, which reflects how young the field is.  Only until the early 1990s did the use of log files become popular among nontechnical persons, particularly with the creation of Analog, one of the first log file analysis programs that was widely available on the Internet, by Dr. Stephen Turner in 1995 . Commercial web analytics started with the founding of WebTrends in Portland, Oregon in 1993, even if they didn’t start selling software until 1995 .  Other important companies are NetGenesis (established in 1994 by MIT graduates), Accrue, Omniture, and WebSideStory (all founded in 1996). By the year 2000, web analytics vendors were struggling with web server logs as optimal sources of data and JavaScript tags emerged as a new standard for collecting data from websites.  JavaScript log files are easier to maintain than web server log files and their use shifts the responsibility of collecting and processing data from internal company IT departments to web analytics vendors in most cases.  Currently the three big vendors are Coremetrics, Omniture, WebTrends.  Mid-market vendors are Unica, Yahoo! Web Analytics and ClickTracks.  Consolidation is common in this industry, for example Omniture acquired the previously fourth big vendor, Visual Sciences (better known as WebSideStory), and Yahoo! Web Analytics was born out of Yahoo!’s acquisition of IndexTools.  Finally there are several basic solutions such as StatCounter and Webalizer.  Google reshaped the web analytics industry in 2005 when it purchased Urchin and, subsequently, released it as a free tool under the Google Analytics  name.  This made first-class web analytics tools available to anybody for free.  The key to success in this industry is constant innovation such as the use of heat maps (cluster of clicks on a web page and their density using colors) from CrazyEgg .  The latest trend in web analytics is moving away from prepackaged key performance indicators (e.g. number of pageviews) towards key actionable insights (e.g. visitor’s primary purpose of visit).  The key trendsetter in the web analytics industry is Google with the Google Analytics tool and Analytics Evangelist, Avinash Kaushik.

Goals, not reports!

What a great last two weeks!

  1. iLovePhotos has launched!
  2. Visits to both of our websites has increased: www.ilovephotos.com and www.bluelavatech.com.
  3. Last week visits to my blog, idaconcpts.com, were 7 times the weekly average! A big thank you to StumbleUpon and to the person who referred to me on this great service.  To this date, StumpleUpon has provided a total of 354 visits (and counting!), that is about 46% of total visits! Mahalo!
  4. Classes started again at the Shidler College of Business, where I am attending my second year at the MBA program.  Currently I am attending Marketing 656: Creativity in Marketing and Marketing 690: US Marketing in the Information Age.  I highly recommend the latter course and you can check out our curriculum at the provided link.
  5. On a personal note, I am back at surfing! : )
Jen Toba.
Life is good here in Hawaii! Photo Credit: Jen Toba.
Let’s talk about the title of this post: goals, not reports!  I have been reviewing Avinash Kaushik’s Web Analytics: An Hour a Day and the clear message from the first 192 pages (out of the 420 of relevant content!) is that any monkey can read web metrics and that the real job of the web analyzer is to provide the neccesary feedback to achieve the prescribed goals and desired outcomes of the website.
/
This might not sound like an epiphany of any kind, but it is a critical starting point for the web analyzer. Chasing metrics for the sake of chasing metrics is not the way to meet and exceed conversion goals, it involves much more.  Web analyzers are obsessed with statistics but the trick is to provide management actionable items.  My reporting strategy, for now, is to provide a statistic and an actionable item.
/
For example:
  • Statistic:  out of XXX visits to ilovephotos.com, XXX% come from USA, XXX% come from Germany, XXX% come from France.
  • Actionable item:  from the XXX visits from Germany, XXX% came from this discussion thread: http://www.macnews.de/news/110985.html, I will make a couple of posts in German to answer their questions.
The approach is to provide my team at Blue Lava Technologies ACTIONABLE ITEMS.  Please note, that these two examples are just day-to-day action items, rather than long-term strategies.  Sorry, but I cannot give away the special sauce recipe! : ) However, I am more than happy to share strategies via e-mail at damian@bluelavatech.com.
/
/
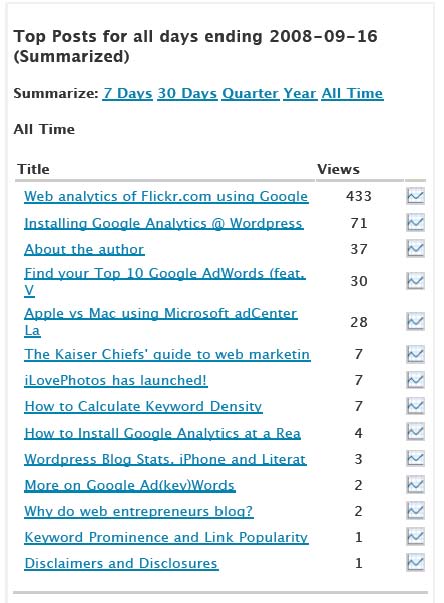
In other news, this is the summary of the top posts at idaconcpts.com:
WordPress Blog Stats
All-time top posts at idaconcpts.com. Source: WordPress Blog Stats
/
Definitely, the hottest topic around is the analysis of Flickr.com using Google Trends.
A follow-up post is in order!  Stay tuned!
/
Cheers!

Installing Google Analytics @ WordPress

This is the second week of idaconcpts.com and I am really happy to have received comments from:

  1. Justo Ibarra from www.doctormetrics.com, to who I would like thank for his help installing the Google Analytics tool at my blog.  Doctor metrics is an Analytics Authorized Consultant and Urching Client Service & Support Partner from Google.  Check out his blog for helpful updates on the state-of-the-art of web metrics.  His blog is only available in Spanish.  The doctor is in!
  2. Avinash Kaushik, author of Web Analytics:  An Hour a Day (which I highly recommended on an earlier post).  His latest post, inspired my last post about doing web analytics of Flickr.com using Google Trends.  His summary of what is Web Analytics 2.0 all about is amazing!  It surely makes my life easier to explain what is my job!  Check out a visual summary below from Avinash’s website:

Today I have spent a decent amount of time installing the Google Analytics tool @ idaconcpts.com and I am sad to tell you that despite the help from both gentlemen mentioned above, the review of several blogs regarding this topic at WordPress and Google; I am very sad to announce that I could only install it on the “About the Author” page.

Let’s review this problem!
WordPress does not allow code in Java:  Even though Google Analytics does provide a copy/paste code for WordPress (just like Shelfari), this code is not accepted because it involves Java code, which is cancelled at WordPress.  There are two ways to get around this issue:
  1. Host your website on a private domain and then use the WordPress application to upload your blog.  (Caveat:  This solution is good for Windows users but it is a bit problematic for Mac users.  Being a recent Mac convert, I will have to keep you posted on how to tackle this issue.)
  2. You can install it the code by deleting from the code all the 4 script type lines.  However, the text will appear and then you will have to hide it using white font. I am aware that my solution is not very elegant but it appears to work.
It is very funny that I tried to discuss this topic at the WordPress Facebook page but it was considered to be inappropriate!  This is surprising because I am no the only one looking for a solution!
Since I hosted idaconcpts.com at WordPress, I don’t have access through FTP to my content, so I cannot incorporate the Google Analytics code into it.
Conclusion:  What are possible solutions?
  • Adding a widget feature to WordPress.
  • Offer the service as an upgrade.
  • Ask WordPress users to be better programmers (ha!).
What do you think?


Web analytics of Flickr.com using Google Trends

On the latest post from web analytics guru, Avinash Kaushik, he discusses into a lot of detail the use of Google Trends as a free and acceptable competitive intelligence tool.

So what is so hot about it?

According to Google:  “With Google Trends, you can compare the world’s interest in your favorite topics. Enter up to five topics and see how often they’ve been searched on Google over time. Google Trends also shows how frequently your topics have appeared in Google News stories, and in which geographic regions people have searched for them most“.

Interesting!  Not only that but “When Google Trends detects a spike in the volume of news stories for a particular search term, it labels the graph and displays the headline of an automatically selected Google News story written near the time of that spike.”  In simpler words, we can find the a plausible explanation for that spike in the search term.

As part of my work, I have to follow closely the activities of Flickr.com.  After reading Avinash’s entry I rushed into doing some web analytis of Flickr.com using Google Trends.

Let’s see what I found out.

Daily unique visitors at Flickr.com
  • The graph above indicates the number of daily unique visits at www.flickr.com.  Flickr’s daily unique visits has gone up and down over time but has an upward trend wordwide.
  • Worldwide visitors who visited this site also visited:
  1. flickr.net (no surprise there)
  2. bighugelabs.com (tools/widgets/applications to use in Flickr)
  3. divinecaroline.com (e-zine for women, so I can have the hypothesis that photo sharing websites should focus on women!)
  4. cracked.com (a place to kill time)
  5. photobasement.com (photo-blog)
  6. failblog.org (photo-blog)
  7. consumerist.com (name says it all, independent consumer report site, don’t really understand the connection here)
  8. digital-photography-school.com (blog that teachers better photography techniques)
  • Flickr is searched mainly in the USA.  Second to the USA, India is ahead of all other countries in looking/visiting Flickr.
  • Inside of USA, California is by far the most active subregion with Flickr.
  • According to this data, consumerist.com and divinecaroline.com are the top other sites visited by Flickr visitors.  #3 is cracked.com.
Search Volume Index of term, photo sharing, using Google Trends
  • The second graph above shows the search volume index for photo sharing.  The letters indicate important news related to that point in time.  It is interesting that these stories are related to a company/organization promoting a better photo-sharing product/service (e.g. Flickr, Avanquest, lenzus.com, Ubicom.

Conclusions:

  1. Photo sharing is only exciting if it is better.
  2. Tools&widgets communities support the further development of a photo sharing community.
  3. Women spend time looking at pictures online. Let’s focus on them!  The wedding photography idea is really good.
  4. There is a connection between consumerist.com and flickr.com.  No idea what it is, but it might worth the while to check it out.
  5. People that spend time looking at pictures online also spend time looking at photo-blogs for quick laughs.

The term conclusions seems a bit overwhelming, I would prefer to name them hypothesis that I would like to further investigate.  However, the main point of this exercise is to demonstrate that Google Trends is a free competitive intelligence tool that provides good ideas to check your web analytics processes.

What do you think? : )

The Kaiser Chiefs’ guide to web marketing newbies

As I work my way in the web of online marketing and web analytics, I often bump into new theoretical and technical lingo that I never heard of.  It is particularly challenging to keep up with both the English and Spanish literature on these fields.  (Oh, if you are self-claimed web marketer and are not checking what’s going in Spain, then you are missing out!)

By far, one my best partners during my web metrics literature reviews are the Kaiser Chiefs.  Named after the South African football team, they are best known for their 2004 hit “I Predict a Riot” and the jumping shenanigans of their lead vocalist, Ricky Wilson.

Ricky Wilson from Kaiser Chiefs @ Brixton Academy. Photo credit: Guy Eppel

Here is what you can learn from them about getting started in web marketing and web analytics.

1. And oh my God, I can’t believe it, I’ve never been this far away from home.

(Oh My God from Employment, 2005)

SEO, SEM, conversion, blog marketing, the list goes.  Not your everyday marketing class, not even in MBA school.  Trust me, I’ve been there and there is very few going on the academic preparation of both undergraduate and graduate students in these fields.  Forget the 4Ps, everything is about conversion.  The first piece of advice that the Kaiser Chiefs drop to you is that you need to realize that you have a lot to learn and, that more importantly, you are to open to learn.  Read, read, read.  A good starting point, you ask?  Here is one:  Avinash Kaushik‘s blog and book, Web Analytics: An Hour a Day.

2.  I predict a riot.

(I Predict A Riot from I Predict A Riot, 2004)

And if one is about to happen, you surely want to be the one to predict it!  Building on my previous post about starting epidemics, while it is very important that you absorb a lot of what is going on the field, it is more critical that you start reading the trends, catch on what-works and what-nots, and start applying it to your own web analytics projects.  And one of the best ways to do this is…

3.  So here we go with the letter.

(The Angry Mob from Yours Truly, Angry Mob, 2007)

…is to start a blog!  Most marketers agree that this is an essential exercise, but there is little agreement about its actual payoff.  It really depends on your objective.  Is it to spark brainstorming sessions?  Is it to network with experts in the field?  Is it to keep track of your evolution as a marketer?  Is it to organize your ideas? No matter what your goal is, having a blog about your projects brings a lot of credibility when presenting yourself to a) colleagues, b) clients, and c) head-honcho investors.

4. It does not move me, it’s not the kind of thing that I like.

(Na Na Na Na Na Naa from Employment, 2005)

This is the last thing that you want coming out from your users/clients/customers.  Yet, most of the time, we fail to listen to them.  Web analytics is ALL ABOUT LISTENING TO YOUR USER.  From MBA school we come quite brainwashed about the product development process and we fail to recognize that it fails miserably when applied to web marketing.  A/B testing, search engine marketing (SEM) and search engine optimization (SEO) are key activities and they are all about listening to your user.  Review blogs, tune into podcasts, identify the current trends!  For some MBA marketing class unlearning, check out The Four Steps to the Epiphany by Steven Gary Blank.

Bonus track

5. Ruby, Ruby, Ruby, Ruby

(Ruby from Yours Truly, Angry Mob, 2007)

For those with advanced coding skills, it would be a good idea to brush up your skills on Ruby on Rails (ROR).  Why should you care?  If you are able to code with ROR, creation of websites and social networking applications (e.g. Facebook) should be a snap!  ROR developers around the USA are on very high demand nowadays with hourly rates going around $80-$150 because everybody wants their online platforms be running smoothly on ROR.

That is all for today and remember the most important lesson from the Chiefs…

Knock me down, I’ll be right back up again

I’ll come back stronger than a powered up Pac-Man!