Apparently, the Japanese seem to think so. Via the eMarketer Daily, I found that according to Marsh Research, 84.4% of adult Internet users in Japan have felt at least once that the Internet is “scary.”Here is the breakdown: Now, why do they consider the Internet scary?
Notice that at the top of the list appears “when lots of pop-up windows opened”. Have you been a victim of a “rickroll”? Definitely annoying. Extreme use of pop-up ads is what Seth Godin refers to as interruption marketing. You’re interrupting the natural flow of the user experience to say “hey, buy this!”. Remember that ads or communications can only be effective if they are relevant, personal, and ANTICIPATED. You need to employ permission marketing (another Godin term). I believe that the only way to a marketer can make a pop-up ad relevant, personal and anticipated is through the use of a tool such as 4Q from iPerceptions. Here’s a 10-minute video explanation of 4Q by Google Analytics Evangelist, Avinash Kaushik.
Here’s an example of how 4Q looks like at the CIO website:
Using permission based marketing initiatives, we can all make the Internet a less scary place. If you want to learn about how to get started with E-mail Permission Marketing, here’s a primer. Once you have read about it, you can learn about E-mail Permission Marketing Fundamentals.
Let’s take for example eMarketer. This company sends daily e-mail updates to people who have a) visited their website, b) are interested in sampling their market data for free before signing up for it (and of course paying for it!), c) have signed up to read the free updates, and d) have provided the company permission to send them daily updates via e-mail. I cannot be more specific about the importance of asking them for permission.
Here’s how they do it:
Notice that there’s no checkbox for the newsletter itself because it is very explicit that the person viewing for the page is signing up for the newsletter. However, notice that there is one checkbox for people who don’t mind receiving news about webinars, event announcements, whitepaper offers, best practices guides, and research briefs.
As you can see, there are plenty of links on this eMarketer newsletter but for simplicity I will focus on the boxed link in the picture above. Let’s imagine that the URL of this link is http://emarketer.com/latestadclickcount.
Campaign Source: Input newsletter because we are talking about an e-mail permission mareketing campaign. I indicate that this is the newsletter #25. Is not mandatory to number them, but I would suggest to do so. It’s important to segment your referrals so you can see what e-mail newsletters are more effective.
Campaign Medium: It’s e-mail.
Campaign Term: In this case, we are paying for keywords.
Campaign Content: Another source to further segment your e-mail campaigns. However, in this simple case it is not necessary.
Campaign Name: I am assuming that this campaign is part of the “CTR products” campaign because the ad talks about CTRs of online banner ads in Europe. eMarketer could be interested in tracking the number of people who click on this article to measure the interest on white papers that discuss CTR optimization techniques, CTR softwares, CTR reports, etc.
The resulting link is http://emarketer.com/latestadclickcount?utm_source=newsletter25&utm_medium=email&utm_campaign=CTR%2Bproducts. eMarketer would use this link as the link on its newsletter.
That’s it! Now eMarketer would have to just wait for the reaction of its The eMarketer Daily recipients.
Once people start clicking on the target link, Google Analytics will start measuring the clicks.
Here’s a sample referrals report:
Google Analytics will report the clicks on the link coming from “Other” sources. The “Other” category will lump all clicks on links optimized with the Google Analytics URL Builder, so that’s why it’s important that you make smart use of the different fields that this tool offers you.
Here’s a teaser for the medium and advanced users of Google Analytics: Once you start using the Google Analytics URL Builder, you can created Advanced Segments to do all kinds of fun segmentation of your data.
So, once you find the total number of clicks on your target URL, you can calculate the CTR of your e-mail permission marketing campaign.
Remember:
Click-through rate (CTR) = number of clicks / number of e-mails opened
I hope that you enjoyed this post. If you have any questions, please leave a comment for this post and I will reply to you within 24 hours.
Thank you for your time!
Disclaimer: I don’t work for eMarketer. I don’t receive any fees or payment for talking about them. I just really like their product.
Thank you for the response via e-mail and comment post at idaconcpts.com about last week’s post regarding E-mail Permission Marketing. If you’re still interested on the free copy of the first 4 four chapters of Seth’s Godin Permission Marketing, please e-mail me at damian [at] idaconcpts [dot] com.
So, you’ve created a great product or service and you have users lining up to register online for your product or service so they can use it. You have provided the option to received personal, relevant, and anticipated messages; and guess what? they are choosing to do so by clicking on the checkbox!. Excellent! You cannot believe that people are interested in you and you send out your first e-mail…and…now what?
This week I’m going to discuss, the basics of the “now what”: the E-mail Permission Marketing Fundamentals.
Before you start your analytics, it is important to understand, at least at a high level, that there several important steps to the process of executing e-mail campaigns:
Define business objectives and how e-mail fits into them.
Identify core criteria for e-mail campaigns (what, why, how, when, and so forth).
Create and execute campaigns (mine your e-mail list, scrub it for do not contacts, create the right text or other type of offering, and send it to your e-mail vendor).
Analyze your campaigns.
Email analytics can focus on both ends of this process: defining objectives and criteria as well as campaign analysis.
As you can see, planning is 90% of any e-mail permission marketing campaign. You cannot expect results, if you don’t have an idea of what good results are. The most important part is that you have to figure a return-on-investment (ROI) for obtaining 1 unit of your desired goal (e.g. one download of a software, one download of a flyer on how-to-stop smoking, one call to one 1-800 number, one view of a blog post, etct). That’s the ultimate goal that you want to set up first before anything. How much are you willing to spend in order to get 1 unit of your desired goal? Once you set that goal, write in 60 font size, print it out, and hang it somwhere visible in your working space. This will guide your overall e-mail permission marketing campaign.
However, before getting to the specifics of calculating the ROI, we need to establish the fundamental metrics. Remember, walking before running. In the case of an effective permission e-mail, you can only have up to 2 goals, for example: a) click here to learn more about my great website, b) click here to download my great free mp3, c) click here to make an appointment, etc.
The funnel strategy of your permission e-mail is that people:
Actually receive your permission e-mail.
Open your permission e-mail.
Click on the link you want them to click.
In order to track these results, you will need the following metrics. Kaushik suggests that you use an e-mail vendor, however I will assume that your operation is pretty small and does not exceed a couple thousand e-mails. At that level, there are only a couple fundamental metrics that you need to worry about.
Number of e-mails sent
Number of opened e-mails
Number of bounced e-mails
Number of unsubscriptions ( You MUST provide this option! Remember that we are doing e-mail permission marketing. No permission = no e-mail.)
With these metrics you will determine:
Delivery rate = (number of e-mails sent – number of e-mails bounced) / number of e-mails sent
Unsubscribe rate = number of unsubscriptions / number of e-mails delivered
Open rate = number of opened e-mails / number of emails delivered
Click-through rate (CTR) = number of clicks / number of e-mails opened
That’s it, nothing more, nothing else, to get started. I believe that even with little or no experience, you should be able to calculate everything except the CTR.
I will disccus the specifics of setting up the measurement of CTR with Google Analytics on the next post.
As part of a MBA assignment, I had to summarize the history of web analytics. I thought it would be nice to share it with you:
– – – – – –
The official definition of web analytics by the Web Analytics Association is the measurement, collection, analysis and reporting of Internet data for the purposes of understanding and optimizing Web usage. This standardized definition was not proposed until 2006, which reflects how young the field is. Only until the early 1990s did the use of log files become popular among nontechnical persons, particularly with the creation of Analog, one of the first log file analysis programs that was widely available on the Internet, by Dr. Stephen Turner in 1995 . Commercial web analytics started with the founding of WebTrends in Portland, Oregon in 1993, even if they didn’t start selling software until 1995 . Other important companies are NetGenesis (established in 1994 by MIT graduates), Accrue, Omniture, and WebSideStory (all founded in 1996). By the year 2000, web analytics vendors were struggling with web server logs as optimal sources of data and JavaScript tags emerged as a new standard for collecting data from websites. JavaScript log files are easier to maintain than web server log files and their use shifts the responsibility of collecting and processing data from internal company IT departments to web analytics vendors in most cases. Currently the three big vendors are Coremetrics, Omniture, WebTrends. Mid-market vendors are Unica, Yahoo! Web Analytics and ClickTracks. Consolidation is common in this industry, for example Omniture acquired the previously fourth big vendor, Visual Sciences (better known as WebSideStory), and Yahoo! Web Analytics was born out of Yahoo!’s acquisition of IndexTools. Finally there are several basic solutions such as StatCounter and Webalizer. Google reshaped the web analytics industry in 2005 when it purchased Urchin and, subsequently, released it as a free tool under the Google Analytics name. This made first-class web analytics tools available to anybody for free. The key to success in this industry is constant innovation such as the use of heat maps (cluster of clicks on a web page and their density using colors) from CrazyEgg . The latest trend in web analytics is moving away from prepackaged key performance indicators (e.g. number of pageviews) towards key actionable insights (e.g. visitor’s primary purpose of visit). The key trendsetter in the web analytics industry is Google with the Google Analytics tool and Analytics Evangelist, Avinash Kaushik.
An important part of my job is to understand the trends in the online photo sharing industry and I wanted to provide a couple of insights to my readers using Google Trends.
Daily Unique Visitors of 5 key players in the online photo sharing industry.
For the period May 2007 – September 2008, Flickr and Photobucket compete for the highest number of daily unique visitors worldwide out of the five selected online photo sharing: Flickr, Snapfish, Shutterfly, Photobucket and Slide.
What caused that there were more daily unique visitors at Photobucket than at Flickr?
Photobucket is capturing more daily unique visitors than Flickr in the top photo sharing market: U.S.
However, Photobucket should not rest in its laurels, because Flickr is ahead in the second most important photo sharing market: India.
What about Slide? Slide enjoyed an important spike in the last quarter of 2007, but its number of daily unique visitors is coming back to previous levels. What caused this?
Worlwide, people who search for the the term “slide”, also search for:
As you can see, hi5 appears several times and it different languages!
This is relevant because hi5‘s daily unique visitors worldwide dwarfs that of the top 5 players in the photo sharing business (note: I drop Snapfish, because Google Trends only accepts 5 websites at a time).
Plus, Slide did pretty good during that period in England!
People who search for “snapfish” also search for “shutterfly”.
And people who search for “shutterfly also search for “snapfish”.
In conclusion:
Markets outside of the United States DO matter! Increased demand in important markets (e.g. Slide in England, Flickr in India) can generate a lot of views, which potentially means increased ad revenue. Just ask Dave McClure, web analytics guru and blogger at Master of 500 Hats.
Despite all the hype about international markets, the leader must keep its focus on the top market, the U.S.
Keep a close eye on the SEO tactics of your rivals and copy what seems to work (Shutterfly and Snapfish).
First of all, it is important to point that it is not possible to see the Daily Unique Visitors graph of http://picasa.google.com using Google Trends. Also a big mahalo (thank you in Hawaiian!) to fellow Photo Lover, Katharine Osborne, for showing me Skitch. This great little image capturing & editing tool for Mac has made my blogging much easier.
Why Picasa? Well, in my personal opinion, the 2 main players for desktop applications in photo organizing & sharing for Mac OS are:
Teaser: what are the differences between the 2 of them? : ) Coming soon!
Since it was not possible to look for the Daily Unique Visitors graph, I looked for the Search Volume Index of the term “picasa”. Here’s what you get:
The letters correspond to relevant news, here’s the list:
The biggest spike, highlighted with the letter A, happened after the release of Picasa 2.0 by Google, back in 2005 which included a series of improvements such as picture captioning and blog-posting ability (for the whole list check here). A spike in the search volume of the term “picasa” is expected around the date of a new release. This is supported by event F, because on September 3, 2008, Picasa 3.0 was released.
What was really interesting is that the United States does not appear among the top 10 regions where the term “picasa” is searched for!!
Is this possible? Is it an error? Let’s analyze the following:
Notice that there appears no U.S. city on the top 10 cities that search for “picasa” and that English does not appear on the top 10 languages!
This finding is very interesting so I adjusted the upper right setting for region from:
to:
and I found that English is the 3rd language of the region when searching for “picasa”!
Conclusions:
The term “picasa” is searched more around the release date of a new version of Picasa.
Google’s Picasa has a stronger presence abroad than in the United States.
Google MUST consider that the majority of its users come from outside of the U.S., so web sites version in different languages might be needed to support its users. This situation is not strange, the same thing happened to Flickr.com.
Why are these conclusions relevant?
Consider the following for Apple’s iPhoto, when looking for the term “iphoto”, this is what I found:
Notice that:
United States is the second region where most searches happen.
8 of the top 10 cities, where the searches happened, are inside of the U.S.
English is the top language of the queries.
This illustrates the difference in strategies between Apple’s iPhoto and Google’s Picasa.
/
Not only is the most popular post at idaconcpts.com, a whooping 67.90% of total post views to date, but also got the attention of web analytics guru and Google Evangelist, Avinash Kaushik!
/
Therefore, I would like to follow up on what has happened since the original post on 08/09/08.
/
First, there has been a movement on the sites that are also visited by visitors of Flickr.com.
/
The 09/19/08 updated list is:
bighugelabs.com (tools/widgets/applications to use in Flickr)
darkroastedblend.com (blog dedicated to complement your daily coffee ritual, nice!)
cracked.com (a blog to kill time, plenty of funny pics and captions)
smashingmagazine.com (delivers useful/innovative information for designers and web-developers)
xbcd.com (RPG game in Chinese, what’s the connection here?)
daylife.com (offers a new media alternative to blogs)
photo.net (everything for photographers: photos, equipment, articles, etc.)
tumblr.com (tumblelogs are a new way to express yourself, see #6)
consumerist.com (independent consumer report site, still unsure about connection)
reddit.com (according to Wikipedia – social news website on which users can post links to content)
Please note that I have done the top 10 list as opposed to the previous top 8 list, because previously the top 3 websites were just name variations of flickr.com (e.g. flickr.net).
Some observations:
Flickr continous to be searched mainly in the USA. Second to the USA, India is still ahead of all other countries in looking/visiting Flickr.
Inside of USA, California is by far the most active subregion with Flickr.
This time I used “flickr” on Google Trends to find its search volume index.
/
Search Volume Index of term, flickr, using Google Trends
/
The letters above indicate important news related to that point in time that the term “flickr” was searched. Previously I concluded that “photo sharing is only exciting if it is better” and this conclusion appears to be true because of the following headlines:
Yahoo buys Flicrk – ZDNet UK – Mar 21, 2005
Flickr goes international with seven new languages – Zee News – May 4, 2007
Photo Editing is now a Picnik for Flickr Members Worldwide – HispanicBusiness.com – Dec 12, 2007
Flickr turns to Getty to sell amateur photos – WJLA – Jul 9, 2008
Furthermore, bighugelabs.com is, at this point of time, the top site also visited by flickr.com visitors.
/
New conclusions!
Photo sharing is only exciting if it is better…, can incorporate other forms of media, and can be embedded in blogs (or new forms of blogs!) with a fresh, new approach!
People that spend time looking at pictures also spend time looking at content-blogs for entertainment.
Still unsure about connection about consumerist.com and flickr.com, also unsure about connection between xbcd.com and flickr.com.
I know, I know, I promised that the next 5 postings would be about the 5 key factors that determine that your website appears on a search engine query, but I really, really, really have to discuss about the implementation of Google Analytics at www.srbienesraices.com.
The main reason is that this will serve as guide for real estate brokers to implement their own Google Analytics code in their websites.
IMPORTANT DISCLAIMERS:
SYLVIA ROJAS BIENES RAÍCES is a 100% Ecuadorean-owned company specialized in the the negotiation of real estate in the provinces of Guayas, Manabí, Los Ríos, El Oro and with representatives in Azuay. The home page is www.srbienesraices.com and is in Spanish.
Since August 2007 I have served as the webmaster of this website.
Sylvia Rojas is my mother.
Since August 2007 I have not received any form of payment for maintaining this website and I have incurred in all hosting payments.
/
Let’s get to work!
/
Check that your website works properly! For example, check for broken links. There is really no sense to track a website that is full of errors. In our case, Sylvia Rojas Bienes Raices (from now on referred as SRBR) consists of only 6 pages so it was real simple to check that the website works like it should.
Once you have make sure that your web site works (if not, then DO IT NOW!), open a Google Analytics account at www.google.com/analytics. If you have an existing Gmail account, you can use that one. If not, then you can create one. In either case, keep things simple, use an existing Gmail account (no need to have 2 Gmail accounts), or when creating a new one, use a name that you can relate your website to. In our case, I already have an existing Gmail account.
Add your Website Profile. You will need your web domain. In our case is www.srbienesraices.com/, please note that I have added the “/” at the end. I am not sure of the importance of this parameter, but I have always included it. (Note to self: look up why we need it!)
Make sure that you indicate what is the default page of your website (e.g. index.html). This is important because otherwise Google Analytics would account www.srbienesraices.com and www.srbienesraices.com/index.html as 2 hits! Unfortunately, that would be cheating!
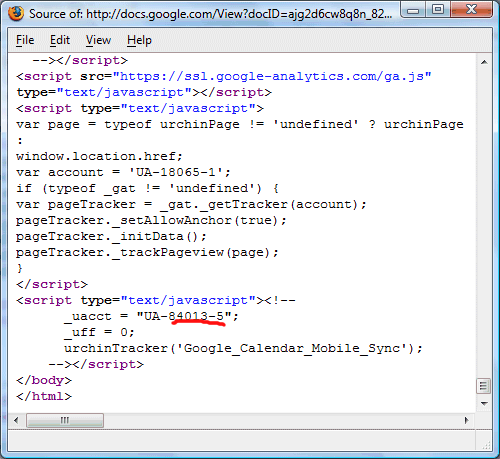
Google Analytics will provide a Java script code that will look like this:
Sample Google Analytics code. Source: http://googlesystem.blogspot.com/2008/03/traffic-stats-for-your-google-documents.html
Please note that the red underlined text will be different. This will be your own Google Analytics account number.
Copy this code.
Open index.html page (home page) using the html editor of your choice. In my case, I use Macromedia Dreamweaver 8. Switch to the code or source view. You cannot paste the Google Analytics code on design view. You must do it on code or source view. Make sure that you don’t see the code when you’re viewing your page in preview view.
Paste the code right before the </body> tag. In our case, it is the second to last line of code.
Save your page. Make sure that you save the changes!
Repeat steps 6, 7 and 8 with all the pages in your existing website.
Sign up to your FTP server of your hosting service and upload all your updated pages that now include the Google Analytics code. Note: yes, you have to replace the existing pages for the Google Analytics to start working.
Confirm that you have entered the tracking code correctly. No idea how to do it? Then try the SiteScan tool from EpikOne, available at www.sitescanga.com, you will just need your home page and an e-mail address to use this free tool. You will receive an e-mail confirming the status of your tracking code, also you will be able to download a report in CSV format (that means you can open it with Microsoft Excel). In our case, the report took 3 minutes and all URLS (6 in total).
Wait 24 hours for the code to kick in! According to Google:
Google Analytics generally updates your reports every 24 hours. This means that it could take 24 hours for data to appear in your account after you have first installed the tracking code.
Conclusions:
The whole process took about 1 hour.
After 2 hours of installation, I have not received any data. This is ok because I am still within the 24 hours. I will check whether Google Analytics has received any data tomorrow.
Google Analytics is a Java script based code so make sure that your browser and hosting accepts Java script.
I am back from a very nice trip to the beautiful island of Kauai here in Hawaii and I highly recommend visiting this beautiful island for some great sights that will blow you away. The Kauai island offers great hiking, kayaking, eating, sunbathing options. If you are interested in visiting an island that keeps that country feeling, then you should definitely visit Kauai.
Here are two samples:
Poipu Sunset - Kauai IslandWailua Waterfall - Kaui Island
Beautiful! Just like today’s topic in the series of the 5 key factors that determine that your website is a returned match on a search engine query. The first posting was about Google AdWords, the second one about Keyword Prominence and Link Popularity.
Calculating your Keyword Density, that is the percentage that your selected keyword is out of the total number of words in a selected number of web pages, takes 4 easy steps.
Step 1: Write the text of your web page on any text editor of your choice (e.g. MS Word). Or just copy/paste the selected text(s) from your website(s) into the word editor.
Step 2: Find out the total word count of your text using the Word Count tool of your text editor.
Step 3: Using your Find tool, find out how many times your keyword appears on the text. Write down that number.
Step 4: Divide the number that your keyword appeared by the total word count. Multiply the result by 100. This is the keyword density of your keyword.
Let’s do an example!
Let’s use the opening paragraph of this post and find the keyword density of island.
Step 1: I copy/paste this text into MS Word.
I am back from a very nice trip to the beautiful island of Kauai here in Hawaii and I highly recommend visiting this beautiful island for some great sights that will blow you away. The Kauai island offers great hiking, kayaking, eating, sunbathing options. If you are interested in visiting an island that keeps that country feeling, then you should definitely visit Kauai.
Step 2: From the menu bar, select Tools, then Word Count. Total word count is 63.
Step 3 : From the menu bar, select Edit, then Find. The keyword “island” appears a total of 4 times.
Step 4: 4 / 63 * 100 = 6.34%
Easy, isn’t it?
Yes, but there are some important points to consider.
–
Major search engines have their own “skip words”. These skip words may or not may not set by the user. Usually words with three or less letters are skipped (e.g. and, or, I, etc.) and not included in the total word count.
Partial matches may or not be included (e.g. island versus islands).
Tags may or many not be included.
–
Therefore, when using online Keyword Density calculators, make sure that you look for these three points. I recommend Google Rankings Keyword Density Calculator (not affiliated with Google).
/
According to Brian Clifton in his How Search Engine Optimisation Works whitepaper, SEO companies usually aim for a Keyword Density between 5 – 10 %. Our previously calculated Keyword Density in the example above meets that criteria. Not too bad.
Keeping the promise that the next 5 posts will be regarding the 5 key factors that determine website appearances on search engine results, I will discuss today keyword prominence and link popularity. The last post was more of a formality that needed to be put in place right away! Please take it as the idaconcpts blog readers’ bill of rights.
When preparing a website for SEO, keyword prominence and link popularity require more work on the developer’s site because the outcome of these tasks will physically alter the layout of that website.
Keyword prominence takes a look at various factors, but the two most important are 1) the physical location of the keyword(s) and 2) the keyword(s) within page link text. Physical location simply means that keywords placed at the top of the page are more relevant than at the bottom of the page. Typically, you will find pay-per-click pages that are trying to maximize their click-rate by using hundreds of keywords at the bottom of the page (either in fine print or mixed with the color of the background). You don’t want to be one of them! In the other hand, keywords within page link text is an art by itself. Check out this free keyword density and prominence tool and use your favorite website. Keyword prominence checks that the keywords that you select for your website should be within page link text. If your site is about web analytics tools. Don’t just say, click here. Better say, for example, click here for better web analytics tools.
Link popularity was invented by Sergy Bin and Larry Page (yup, those Google guys) and it is the foundation of their Search Engine Google. In simple words, link popularity deals with the quantity and quality of the links leading towards your website. It is not just a matter of every possible website linking back to your website, but rather the ones that are relevant to your keywords.
Conclusions:
Mark your keywords clearly at the top of every page of your website.
Network! Talk with experts in your field and create partnerships with them so that you can cross-reference each other.

 Now, why do they consider the Internet scary?


 Before you start your analytics, it is important to understand, at least at a high level, that there several important steps to the process of executing e-mail campaigns:
 With these metrics you will determine: